Impacts of climate change on length of growing periods in Africa by Philip Thornton
The International Food Policy Research Institute (IFPRI) has published an atlas illustrating the current state of African smallholder agriculture.
The Atlas of African Agriculture Research and Development comprises a series of maps and short analyses that showcase and locate the continent’s diverse agricultural challenges and opportunities. Seven topics are covered: political, demographic, and institutional classifications; the footprints of agriculture; growing conditions on the continent; the role of water in African agriculture; drivers of change in African agriculture; access to agricultural trade; and human welfare.
In briefs facing each map, the Atlas answers four questions: What are these maps telling us? Why is this important? What about the underlying data? Where can I learn more? By presenting a broad range of geospatial data and explanatory text, the analysts hope the Atlas will serve as a reliable and up-to-date guide for informed decision-making, which can help speed, broaden and sustain Africa’s agricultural productivity.
Impacts of climate change on length of growing periods in Africa by Philip Thornton
What are these maps telling us?
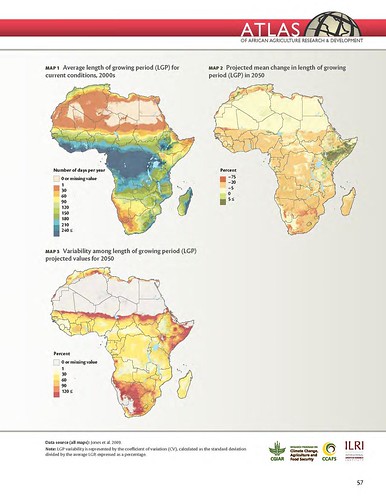
Projections show that climate changes between now and the 2050s may significantly affect the length of growing periods (LGP) in Africa. LGP, expressed as number of days per year, is a metric that integrates rainfall, temperature, and some soil conditions to determine when crops grow in certain areas (Map 1). It is a useful proxy for season type in the water-limited conditions that prevail in many parts of the tropics. LGP ignores intervening drought periods and so it is not always a good indicator of cropping success, but it is often highly correlated with yields.
Map 2 shows the projected percentage change in LGP in the 2050s compared with current conditions, using a scenario of high greenhouse gas emissions and several global climate models. Most of the continent will see reductions in LGP, some of them severe. Parts of eastern Africa, particularly the Horn of Africa, may see some increases, but in these areas, current LGP is low (90 days or less, Map 1).
The climate models used to project LGP do not all agree on how the climate may change by 2050. Map 3 shows the variability in projections for LGP estimated from several climate models. Since areas with lower values, such as much of central Africa, show more agreement between the various climate models, one can have more confidence in projected LGP changes in these areas. In areas with higher values, the climate models agree less, meaning the projections of LGP change are less reliable.
Why is this important?
To effectively adapt to climate change, farmers, governments, and other stakeholders must understand the potential effects on crop and livestock production. A contracted growing season can impact crop and livestock productivity, particularly in areas where growing seasons are already short. Temperature increases and rainfall changes could push some of these areas to a point where cropping may fail in most years.
Some farmers may be able to adapt to shorter growing seasons by planting varieties that mature more quickly; other farmers may need to change to more drought- and heat-tolerant crops. Increase in LGP may present more growing opportunities, but it is uncertain how the change in growing time would impact soil moisture.
As climate changes, the distribution of crop pests and diseases may change, too. Of course, LGP is only one metric; the information shown here can be combined with or compared to other aspects of projected climate change—such as temperature changes—to create a more detailed picture of how climatic shifts could affect crop growth and development.
More information
Production of 30-plus maps covering the 7 topics took more than 5 years of work and the collaboration of many experts and organizations, including the Australian Centre for International Agricultural Research (ACIAR) and the UN Food and Agriculture Organization (FAO) on Africa’s diverse farming systems; McGill University on the extent of crop- and pasturelands; HarvestChoice and IFPRI on agroecological zones; and Welt Hunger Hilfe, Concern Worldwide and IFPRI on the severity of hunger.
Scientists at the International Livestock Research Institute (ILRI) produced four of the maps and accompanying analyses:
- ‘Livestock and mixed crop-livestock systems’ and ‘Impacts of climate change on length of growing period’,
by Phil Thornton, of ILRI’s Livestock Systems and Environment Program
and the CGIAR Research Program on Climate Change, Agriculture and Food Security - ‘Ruminant livestock’ and ‘Benefits of trypanosomosis control in the Horn of Africa’,
by Tim Robinson, also of ILRI’s Livestock Systems and Environment Program

It looks rather threatening that the already short growing days in the Eastern African region will have serious implications on the bad food status of the region.The long term plans should emphasize on large scale water harvesting by governments and donors to ensure some basic crop production by small scale farmers who are the most susceptible!